For decades, the standard vocabulary of the average television viewer contained a word that sounded like it belonged to a suburban cult: the “Nielsen family”.
If a favorite prime-time drama was suddenly canceled, fans blamed the Nielsen families. If a brainless sitcom stayed on the air for a decade, it was because those secret, chosen households apparently could not get enough of it. For the millions of Americans sitting on their couches every night, the television landscape was governed by a shadowy aristocracy of normal people whose living rooms were tapped by a corporate research giant.
But how did this actually work? How did a company headquartered in Ohio and Florida convince the entertainment industry that a tiny sample size of households could accurately represent the tastes of an entire continent?
The reality of how television ratings worked is a fascinating mixture of mid-century engineering, analog trust, and a massive, multi-billion-dollar game of statistical projection. And as it turns out, the way we measured what we watched was always far more fragile than the networks ever wanted to admit.
The Mechanical Spy in the Living Room
Long before television took over the American home, a market researcher named Arthur C. Nielsen was trying to figure out what people were doing when they thought no one was watching. In the 1930s, Nielsen bought the rights to a mechanical device called the Audimeter.
When attached to a radio, the Audimeter used a stylus to scratch lines onto a moving roll of paper tape, physically recording exactly when the radio was turned on and what station the dial was tuned to. In 1942, Nielsen launched the Nielsen Radio Index, sending field technicians to several hundred homes to physically swap out the paper tapes.
When television exploded into American culture after World War II, Nielsen adapted the technology. In March 1950, he purchased his main rival, C.E. Hooper (famous for “Hooperatings”), and launched the Nielsen Television Index.
The early TV Audimeter was a heavy, mechanical beast. It was wired into the back of a family’s television set and recorded tuning data onto 16mm film cartridges.
To convince families to let this mechanical spy sit in their living rooms, Nielsen offered a brilliant, highly enticing bribe: free television repair services. In an era when vacuum tubes constantly burned out and a broken television could sideline a family’s primary source of entertainment for weeks, having a dedicated “TV Index” representative on call to fix your set for free was the ultimate luxury.
Every week, the Nielsen family would pull the film cartridge out of their “black box,” mail it to Nielsen headquarters, and pop a new one in.
But there was a glaring flaw in this mechanical triumph. The Audimeter could tell Nielsen that the television was turned on and tuned to CBS, but it could not tell Nielsen if anyone was actually sitting in front of the screen. The TV could be blaring a variety show to an empty room while the family was asleep, eating dinner, or fighting in the kitchen.
To solve this, Nielsen had to rely on something far less reliable than a machine: human memory.
The Era of the Paper Diary
In 1953, Nielsen introduced the paper “viewer diary”.
Alongside the electronic meters, Nielsen recruited a separate, rotating panel of households to keep physical logbooks. Each diary was a small booklet kept near the television set. Every time the TV was turned on, the family was expected to write down the time, the channel, the name of the program, and exactly who was watching.
This allowed Nielsen to gather “demographics”. It wasn’t just about how many homes were tuned to a show, but who was watching. Advertisers did not want to pay premium rates to show car commercials to seven-year-olds; they wanted to target the “buying public”—primarily adults aged 18 to 49.
Keeping these diaries was a tedious chore, and Nielsen compensated families with a shockingly small token of appreciation: usually just a few crisp, sequential one-dollar bills mailed in the packet.
The paper diary system relied entirely on the honor system, which meant it was incredibly inaccurate. Psychologists and media researchers have long pointed out the inherent biases of the Nielsen diary:
- Prestige Bias: Diary keepers frequently lied to make themselves look better. They would write down that they watched prestigious documentaries or educational programming on PBS when they had actually spent the evening watching trashy game shows.
- The Sunday Night Recall: Many families did not fill out the diary in real-time. Instead, they would wait until Sunday night, sit down, and try to remember everything they had watched over the past seven days. Naturally, they wrote down the highly promoted, famous shows they thought they watched, completely forgetting the weird local broadcast or syndication rerun they caught on Tuesday afternoon.
- First-Channel Bias: If a diary keeper turned on the TV and watched three different shows on the same channel, they would often just draw a single line down the page, giving the network an unearned boost in loyalty.
Despite these massive holes in the data, the paper diary remained the bedrock of local television measurement for over sixty years, finally being retired by Nielsen in June 2018.
The Ritual of “Sweeps”
Because mailing, collecting, and hand-tabulating millions of paper diaries was incredibly expensive and time-consuming, Nielsen did not do it year-round for every market. Instead, they focused their efforts on four specific month-long periods every year: February, May, July, and November.
These were the legendary “sweeps” periods. The term originated because Nielsen would process the incoming diaries geographically, “sweeping” across the country from the East Coast to the West.
The ratings a local television station received during these sweeps months determined how much they could charge local advertisers for commercial airtime for the next three months. If a station pulled terrible ratings in November, their revenue would crater all winter.
This created a highly entertaining, completely artificial programming cycle. During sweeps weeks, networks and local stations pulled out all the stops to juice their numbers. This was when hit shows featured massive, shocking cliffhangers or character deaths. High-profile guest stars suddenly made random cameos. Sitcoms did special, hour-long “destination” episodes where the cast traveled to Hawaii or London. Local news broadcasts aired sensationalist, fear-mongering investigative exposés to hook casual channel surfers.
The July sweeps period was traditionally the lowest-rated of the year because Americans were outside enjoying the summer weather instead of huddling around the television, which is why July was historically the dumping ground for network reruns.
Ratings vs. Share: The Hidden Math
When the industry discussed a show’s success, they used two distinct statistical metrics: “ratings” and “share”. To understand how television worked, you had to understand the difference between the two numbers.
Imagine a show is reported to have earned a “10 rating and a 15 share” (often written as 10/15).
- The Rating: This is the percentage of all households with a television that were tuned to that specific show. If there were 100 million TV households in the country, a 10 rating meant 10 million homes were watching.
- The Share: This is the percentage of households actively watching television at that exact moment that were tuned to that specific show.
If it was 11:30 PM on a Tuesday, only 40 million of those 100 million households might have their televisions turned on. If 6 million of those homes were watching The Tonight Show, Johnny Carson didn’t get a 6 rating (which is based on all 100 million homes); he got a 15 share (6 million out of the 40 million homes actively watching).
A show could have a relatively low rating but a massive share if it aired during a late-night or early-morning time slot when most people were asleep. Advertisers looked at ratings to see the raw size of the crowd, but networks looked at share to see how well a show was competing against the other options on the dial.
The People Meter and the Modern Meltdown
In 1987, Nielsen tried to drag TV measurement out of the dark ages of memory and paper by introducing the “People Meter”.
This was a box placed on top of the television, accompanied by a remote control. Each family member was assigned a specific personal button on the remote. When they walked into the room to watch TV, they had to press their button. If they left, they had to press it again.
While the People Meter gave networks overnight, demographic-specific data, it also introduced a new form of viewer fatigue. Teenagers forgot to check in, tired parents didn’t bother checking out, and the data was frequently skewed by human laziness.
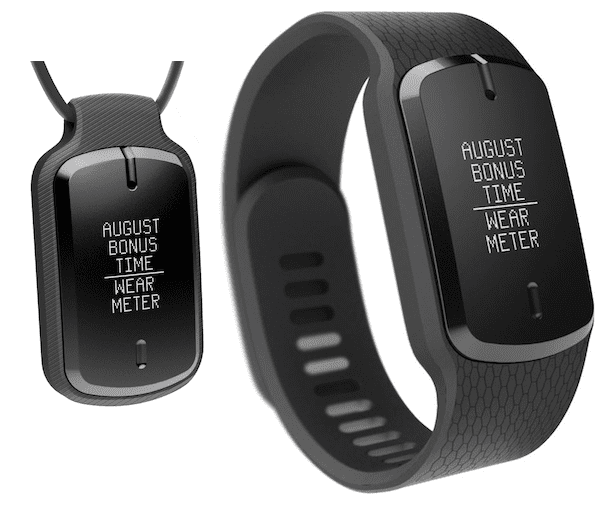
As the media landscape fractured with the arrival of hundreds of cable channels, the VCR, the DVR, and eventually streaming, Nielsen’s statistical models began to buckle under the weight of modern choices. The company spent years scrambling to fix its blind spots. In 2021, they announced a major push to modernize their panel by testing wearable “Portable People Meter” devices. Designed as wristbands, clips, and pendants, these gadgets were built to passively track media consumption via hidden audio watermarks—bypassing the need for active button-pressing altogether in an effort to increase compliance among tech-fatigued demographics. By 2025, an expansion of these wearables allowed Nielsen to claim 100% out-of-home measurement coverage across the contiguous United States, followed by pilot programs testing smartwatch-style devices during major live events like the Super Bowl to capture accurate “co-viewing” metrics when multiple people watch the same screen.
Yet, the basic math of modern attention remains an uphill battle. In the 1970s, a hit show like Dallas or M*A*S*H could easily capture a 30 rating and a 50 share—meaning half of all people watching television in America were watching the exact same thing. Today, a broadcast network is thrilled if a show pulls a 1.5 rating.
With audiences scattered across thousands of different digital destinations, relying on a panel of a few thousand representative households to accurately capture what a country of hundreds of millions of people is watching has become an almost impossible task. For over half a century, those cardboard diaries and blinking black boxes decided what stories were told, what actors became stars, and what cultural moments we shared. We didn’t choose what we watched; the Nielsen families chose for us.